Nielsen: Bestsellers, Trends and the Magic of Data
❄
3:00 PM, 1 June 2017
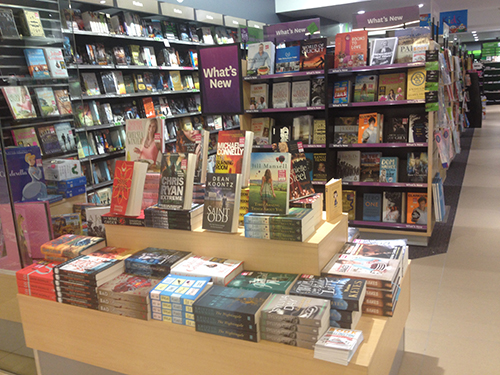
Looking at the Nielsen Bestsellers is a staple of pretty well every bookseller’s data diet. Each month, the Booksellers NZ website receives 1,600 views of the bestseller charts, for which we pay a contractually arranged subscription that allows us to pass them on to our members.
We thought it was worthwhile, with this in mind, to drill down into where this data comes from, how it is managed and curated, where the data goes, beyond New Zealand subscribers – and when we will be getting e-book sales data. We put these questions to Nevena Nikolic, the Sales and Marketing Manager for Nielsen Book.
The BookScan panel and Indies charts
At the moment, the BookScan panel is currently made up of LS Travel Retail (the airport bookshops), Paper Plus Group, The Warehouse, David Jones, The Nile, a weighted sample of independent general bookshops, and a few specialist bookstores (academic and children’s). The weighting takes into account the number of indie stores in New Zealand – pulling in a percentage for those that can’t/don’t contribute.
Nikolic would like more stores to sign up, saying, ‘We would love to have a 100% universe, but that won’t ever happen. The store must have an EPOS system that can send the data automatically, which is why there are a few small retailers that aren’t part of the panel. We also have stores that choose not to be part of BookScan.’ Three retailers are being added to the panel this year, which is great, but Nikolic adds, ‘The panel we currently do have gives us enough data to show the key trends happening with book sales in New Zealand.’
The Indie Top 20 is based only on book sales from independent members of the BookScan panel. Nikolic says, ‘Because we don’t do any reporting via channel (e.g. chains, online etc) the Indies’ Top 20 reflects their own sales better than the General Bestseller List. As a generalisation, the Indie Top 20 is more literary and NZ-focussed, while the General Bestseller lists is dominated by imported big brand authors.’

Validating the data: and why e-book sales are still on their way
The weekly bestseller lists cover the week from Sunday through Saturday. Nikolic explains how the reports are made: ‘The data comes into our system every day, then the sales are aggregated and sorted automatically after the week ends. But here’s the manual bit: from Monday until Wednesday, we go through checks and validations from automatically generated reports. Each week, Georgina and Vimala on the BookScan team check the sales for any unexplained quantities or title queries; this may involve going back to the retailer to confirm sales.’ Once all the data is validated, it is released to Booksellers NZ on Thursday morning, ranked by volume.
In other words, the physical sales are registered at point-of-sale by the retailer; this is the basis of all validation for sales rankings on physical books. So why can’t we do this for e-books? Where is the long-promised e-book data?
The e-book data is coming via PubTrack Digital, which uses publishers’ own data (which e-retailers such as Amazon and so on have given them). The e-retailers don’t give their data direct to Nielsen, which means, Nikolic says, ‘that it has been a lot more complex to set up, compounded by the fact that we are setting up via Australia because the multi-nationals generally do not handle e-book data out of New Zealand. We are aiming for a soft launch [of e-book sales data] in August and then going live in October.’
However, bookshops will need to wait a bit longer still, says Nikolic, as ‘the data will only be available to the participating publishers initially, so it will be great for those publishers to have market context for their title sales, regardless of format.’
The confusion of categories
At the Booksellers office, we noticed current bestseller Good Night Stories for Rebel Girls had jumped from international non-fiction to international kids and back again recently. We asked Nikolic where this categorisation is coming from.
‘The publishers, is the short answer!’ says Nikolic. ‘When the publishers give Nielsen their title metadata they give each title a product categorisation, and in New Zealand this is the internationally recognised code called BIC (Book Industry Communication). This is soon to be replaced by Thema, which will give publishers a deeper, more nuanced level of categorisation.’
She explains: ‘Each title can only have one product categorisation which originates from the source publisher and sometimes they can be a bit subjective – particularly with non-fiction. So, in the case of Good Night Stories for Rebel Girls, it could be children’s non-fiction or its current BIC: “Biography: historical, political & military (BGH)” – the publisher may have changed their mind.’ As publishers are able to change their data within 24 hours, changes do appear swiftly.
If you find a Kiwi author on the international charts, this will be because the publisher is international. For instance, The Energy Guide, by Dr Libby was published by Macmillan Australia. ‘The NZ/international place is determined by the source of the ISBN,’ says Nikolic. ‘So Nielsen isn’t moving titles on to the various lists arbitrarily – the publisher determines where they fall. If you are a bookseller subscribed to Nielsen BookData Online, you can check the BIC codes on the title record.’ A subscription directly to BookScan also gives publishers access to week-to-week title movements.
Who sees the sales quantities?
‘Publisher clients subscribe to access the data on a weekly or four-weekly basis, and we give a Top 300 chart back to the retailers that contribute their data – as a reciprocal data exchange,’ says Nikolic.
‘Also, Nielsen BookScan is part of the world’s largest continuous sales monitoring system, which operates in nine countries globally (UK, Ireland, Australia, New Zealand, India, South Africa, Italy, Brazil and Spain) so some of the multi-national publishers have access to more than one territories’ sales.’
Books as an indicator of societal trends

Nikolic has been in her role for around 3 and ½ years now, and there have been several trends come through over that time. We asked Nikolic what data trends have fascinated her the most.
‘One of the key things has been how sales phenomena such as colouring books can completely take over the lists and dominate for a period and then completely disappear! And how societal trends are also reflected in the lists, such as an increasing interest in health and wellness also translating to a spike in sales for wholefood and health books; or a spike in spoof and humour books when politics is bleak on a global scale.
‘Books sales trends are really a barometer for society’s interests in the wider world outside of books and while there are few surprises on the bestseller lists generally (yes, we have an ongoing love affair in New Zealand with cooking and sports), there are also those titles that seem to come from left-field which clearly speak to booklovers on a mass scale.
‘So don’t shoot the messenger next time you see something on the list you don’t like – Nielsen is simply aggregating the sales that reflect consumers’ interests!’
ENDS